


Mobile apps are flooding the mCommerce market. Why?
Every fifth person in the world owns a smartphone, and 85% of them prefer native mobile apps to websites.
This means that retailers need to focus on their app engagement strategy to stand out from the crowd. For those who haven’t yet developed an app, they need to get it right away.
In a recent report, 42% Retailers and ad agencies ranked ‘engagement’ as their primary goal of mobile apps strategies. Therefore, whether you are rooting for conversion with in-app purchases, paid subscriptions or in-app advertising, your key strategy always comes back to engagement (and personalization).
However, the question is, how do you define the engagement rate of an app? There are broadly 5 basic areas that are considered, i.e:
- The ratio of the Daily App Users to Monthly App Users
- The average visits per month, such as the frequency of opening the app, average duration of visits, etc
- The average time spent in the app, duration of each session, etc.
- The screen views, like the number of screens each user visits.
- The retention rate, such as the number of visits by new users, after the app in installed.
To drive engagement means to acquire deep insights about your user, optimize how you acquire them and understand your app user’s behaviour on the kind of content they respond to the most.
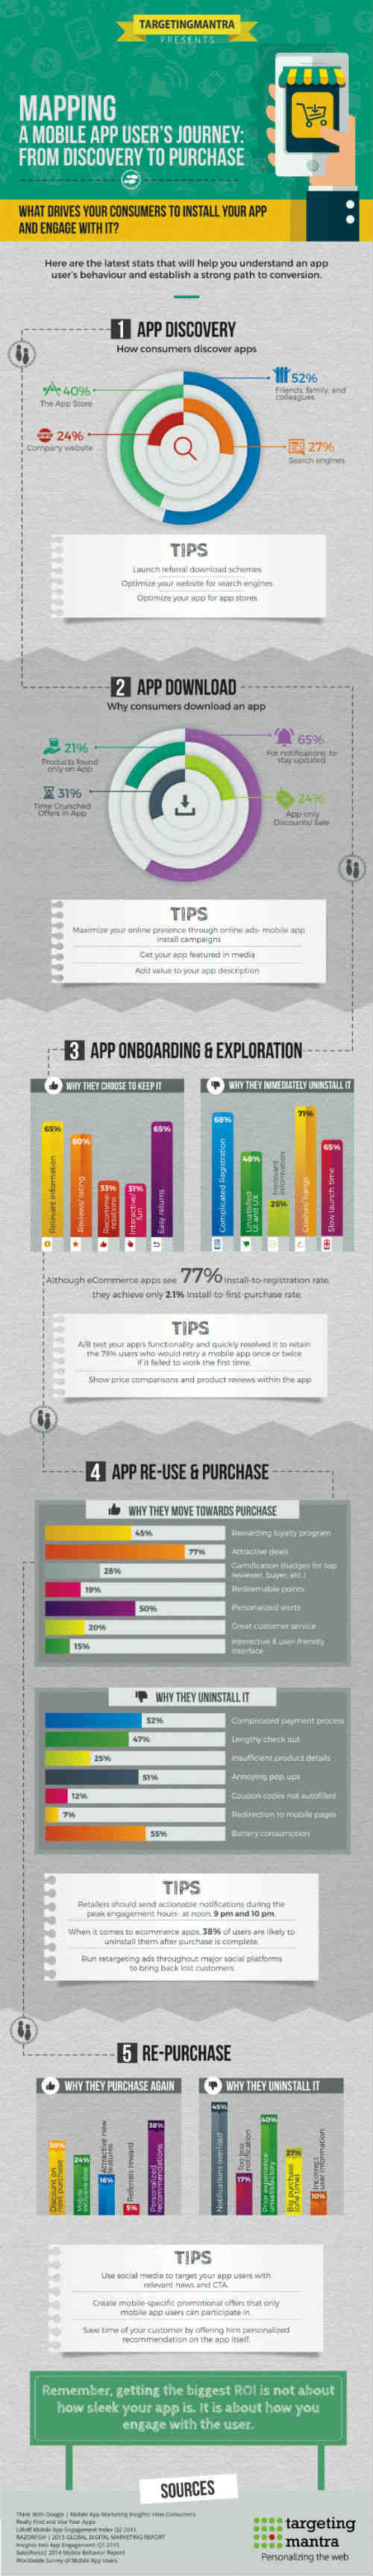
To begin with, you need to understand your app user’s behaviour, from the app discovery to purchase, in five steps, viz:
- App discovery
- App Download
- App Onboarding & Exploration
- App reuse & purchase
- Repurchase
Cutting to the chase, we have created an infographic with some staggering stats that will make you rethink your app engagement strategy and plan a more careful marketing mix. Don’t forget that understanding your app user is the first step to driving more app installs and engagement.

These stats show that people are spending more time with apps for their personalized, intuitively designed, and task-oriented features. It also shows that push messaging is ideal for re-engaging inactive users, and in-app messaging can motivate your active users toward conversion.
Lastly, after you have the app engagement strategy, here are three ways you can measure your mobile engagement campaign:
- Think beyond opening an app. Think about ‘what to do after installs?’
- Define conversion for your brand.
- Look for ways to improve impressions and clicks.
Download an interesting research on what works (and what doesn’t) in email marketing for ecommerce by TargetingMantra.